Measurement of 3D Phoneme-Specific Radiation Patterns in Speech and Singing
Brian FG Katz, C. d’Alessandro
Contents |
Abstract
We present the preliminary results of a detailed measurement study on spoken and singing voice directivity under various conditions in two- and three-dimensions. Unlike previous studies that have used average directivity data over spoken phrases, sung phrases, or crescendos, this work presents results that are measured and analyzed in finer detail. Two talkers and a professional opera singer (counter tenor) participated in the experiments.
Details of the measurement protocol and post-treatment processing are presented. Specifically, the variations in directivity relative to pitch, level (piano, fortissimo, etc.), vowel, and controlled “voice projection” by the singer have been investigated. The application of directivity patterns to radiating sources in computer simulations and auralizations is common for loudspeaker models. Few applications include the directivity patterns of natural sources, partly due to the lack of sufficient data. Results of this work are applicable to vocal production research, simulator design, room acoustic sound field prediction, and virtual reality systems with musical applications. These results were performed in the context of, and are being included in another LIMSI project : 3D Audiovisual Rendering and Real-Time Interactive Control of Expressivity in a Talking Head. This document presents a summary of two conference presentations: “Human voice phoneme directivity pattern measurements” and “Directivity Measurements of the Singing Voice” [ASA2006] [ICA2007].
Introduction
While there have been numerous studies concerned with the directivity of musical instruments, there have been very few studies concerned with the directivity of the human voice. Human directivity measurements for 66 spatial positions and 13 frequency bands have been reported in the pioneering work of Dunn and Farnsworth [1] using one speaker repeating 15s of speech. The results show a greater variation in directivity patterns at higher frequencies. Directivity variations linked to the size of the mouth opening occurred above 5600 Hz. Flaganan [2] proposed new measurements with a calibrated artificial sound source in a mannequin. He also compared the results obtained with simple analytic models: piston in a sphere, baffled piston. Using an array of microphones mounted on a double arc Chu and Warnock [3] showed that similar directivities were obtained for both normal and loud voice levels but significant changes behind the talker were observed for low voice level. No significant differences in directivity were detected between male and female talkers although male and female voices had different spectra. An effect of the aperture size of the mouth has been studied [4]. Open and close vowels give different patterns above about 1000 Hz. This seemed in agreement with an analytic model of a piston (corresponding to mouth aperture) radiating on a sphere (with corresponding head radius). Finally, Kob and Jers [5,6] compared radiation patterns for an artificial singer head and real singers, showing comparable results for sustained vowels.
Motivation of the Work
In the present work, we investigate several aspects of radiation patterns of the human voice. Regarding the spoken voice, the main question is a study of the variations with directivity relative to the spoken phoneme. This condition is studies by measuring the directivity for a variety of sustainable individual phonemes. Regarding the sung voice, A first question is the difference between loud voice and soft voice, as discussed by Chu and Warnock [3]. A second question is the effect of the sung vowel as discussed by Halkosaari, Vaalgamaa, and Karjalainen [4]. A more challenging question arose from discussions with professional singers who are often called to sing in large rooms. In voice pedagogy, many singers are using the metaphor of voice “projection” or voice “focusing”. This terminology seems to imply some sort of spatial effect or voice directionality control. A matter of serious interest with regards to directivity this metaphor is only a matter of singer’s perception or whether it resulted in actual changes in voice radiation patterns. These conditions are studied using sustained vowel singing and 1/3rd-octave band analysis. This provides detailed results for these various conditions which have not previously been presented.
Measurement Protocol
Measurements were performed in the anechoic room of the l'Institut de Recherche et Coordination Acoustique/Musique (IRCAM). A 180° arc with 24 equally spaced microphones on a motorized arm capable of elevations from -45° to 90° (see Figure 1) was used. A chair was placed at the center of the arc, and the singer’s mouth position was aligned to the exact center using fixed laser pointers. The chair was equipped with a head rest to assure a stable position throughout the measurement sessions. The chair could be oriented either to the center of the microphone arc or to the end of the arc. In addition to the 24 microphones along the arc, 2 reference microphones were also included. These microphones consisted of a calibrated measurement microphone at a fixed position in-front of the singer, as well as a head-worn vocal microphone and were used for calibration between repetitions and all spectral analysis. The calibration procedure for the microphone arc used a small loudspeaker was placed at the signer’s position. The arc was raised to 90°, such that the arc was coplanar with the diaphragm of the loudspeaker (the two being axis symmetric). Pink noise was played and the recorded signals were analyzed in 1/3rd-octave bands. Calibration levels were derived to obtain an omni-directional response for each band. A video camera at a fixed position, and high contrast lip make-up were used to help analyze lip forms. The position of the measurement reference microphone and camera are shown in Figure 1. The lip make-up and head-worn vocal microphone are also visible. To aid the subject in maintaining a constant vocal effort and pitch within the anechoic chamber two types of feedback were provided. An electric tuner display, located under the camera, was used to help subject maintain pitch. An audio return over closed headphones (to avoid contamination of the measurement signal) with which an artificial reverberation was also added (seen in Figure 2). This audio return was found to be useful by the subjects over the 4 day measurement session. The artificial reverb (Spat, under Max/MSP) used the signal from the head-worn vocal microphone. The reverberation was adjusted to the comfort of the singer as being that of a quality large performance space. The reverberation time was approximately 1.7 sec, with a direct-to-reverberant ratio of approximately 19 dB.
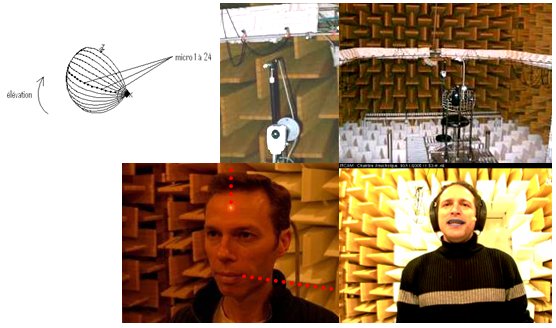
Figure 1. (a) Motorized measurement arc schematic (b) Anechoic chamber configuration (c) Signer alignment procedure (d) Reference microphone and camera placement (e) Head-worn microphone and close headphones.
Results
While measurements were acquired for a large number of conditions, only several conditions have been chosen for presentation in this work to provide examples of effects either observed or not, as a function of vocal parameters.
Spoken Voice
Analysis of the spoken voice measurements has been performed following two approaches. The first, it simple to examine the directivity patterns for certain phonemes. The second is an attempt at data reduction through the use of cluster analysis of the directivity patterns themselves. In order to simplify the measurement acquisition and analysis task only sustainable phonemes were included in the protocol (vowels such as /a/i/o/ and consonants such as /m/n/f/s/ch/). Therefore, there are no impulsive phonemes (such as /p/t/).
Individual vowel differences
The directivity of each phoneme has been calculated using the microphone arc array, and following a one-third octave band frequency filter separation. The results for /a/o/i/ are shown in Figure 2 for several frequency bands. As can be seen, there are marked differences for certain mid-frequency regions, while for low and higher frequencies the directivity patters are almost identical.
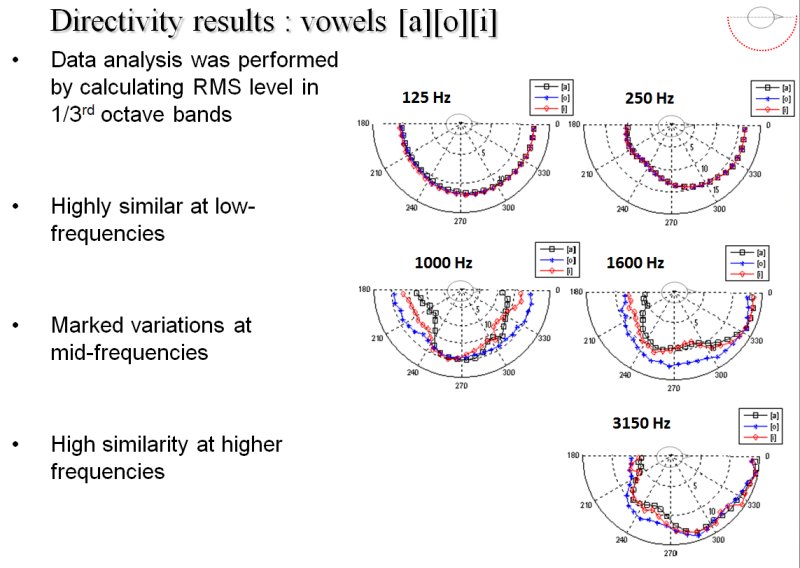
Figure 2. Directivity of sustained vowels a/o/i/.
For consonant phonemes, several examples are show in Figure 3. Again, there are regions where there are similarities and others where there are clear variations.
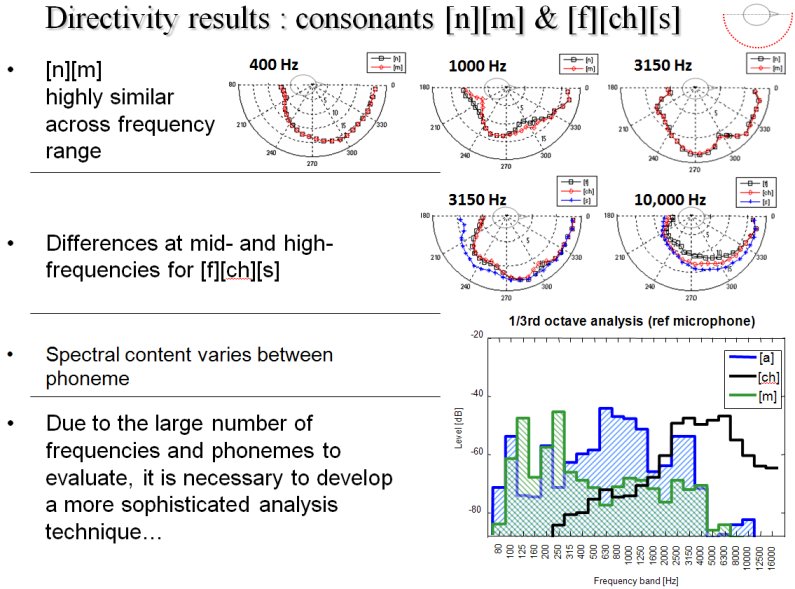
Figure 3. Directivity of sustained consonants n/m/f/s/ch.
Importance of spectral content
While there may be evident differences in the directivity patterns for different conditions, it is important to verify that there is actual energy in these frequency regions. As a directivity diagram is normalized, there is no information inherently contained in it to represent the radiated energy. Figure 3 includes the spectral energy for 3 different phonemes with very different directivity patterns; /a/ch/m/. It is clear that when comparing directivity patterns, one must be sure that there is also sufficient energy produced to warrant the comparison.
Cluster analysis of directivity patterns
As this measurement protocol has produces a large quantity of data, several methods for data reduction are under consideration. One such method tested has been to perform a cluster analysis on the similarity between directivity patterns. The similarity has been calculated using the correlation coefficient between patterns in the third-octave bands. Cross-band analysis has not yet been performed. The overview of the cluster analysis results in shown in Figure 4, where the data values correspond to (1-correlation coefficient). A value of 0.2 was used for the cluster separation. Results have been grouped to highlight the apparent fact that for certain frequency regions there are little differences between phonemes, while at other frequencies there are definitely different patterns.
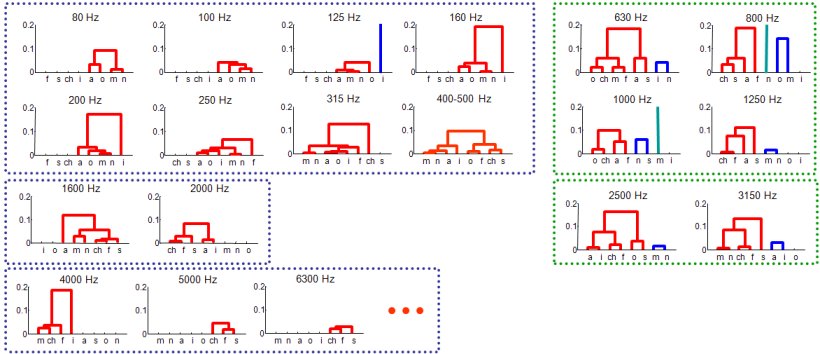
Figure 4. Cluster analysis of correlation between directivity patterns.
An example of a comparisons between “similar” patterns in the same cluster and “different” patterns from two cluster groups is shown in Figure 5.
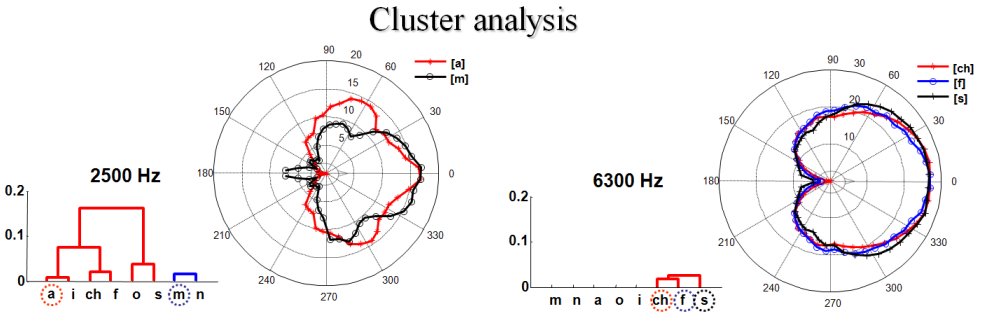
Figure 5. Comparison of cluster analysis directivity pattern results.
Sung Vowel
Variations in spectral content for sung vowels are well known. These spectral changes are linked, at least in some part, to changes in the mouth geometry of the singer. Whether there is an effect on the directivity is to be examined. Figure 6 presents the directivity pattern in the horizontal plane, in 1/3rd-octave bands for the sung note a, vowels /a/i/o/. (The French notation for the note was siB2, and was actually sung a ½ tone lower due to the baroque tuning used by the singer.) The data was measured on one side of the signer only and mirror-symmetry has been employed to form a complete circle.
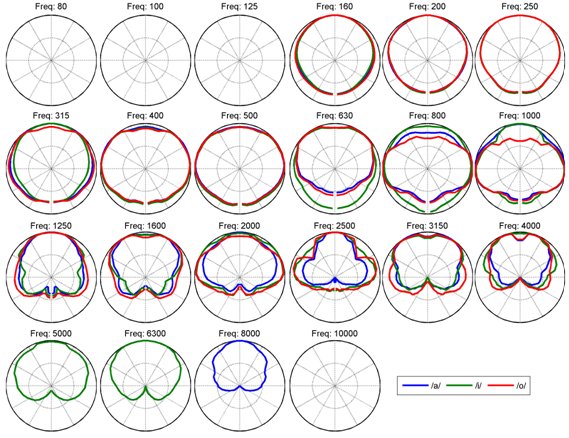
Figure 6. Directivity patterns for sung vowels.
There are a number of observations that can be drawn from these results. First and foremost, it is clear that the directivity pattern varies with frequency. The low frequency region is near omni-directional, as one would expect, until 600 Hz~1000 Hz, or the region where the head dimensions are comparable to ½-wavelength. The mid-frequency region (1250 Hz – 4000 Hz) shows a range of patterns, with the upper frequency bands becoming more cardioid in nature. At the same time, there are not significant variations between vowels in the directivity patterns. The most marked differences are around 800-1000 Hz, at 2500 Hz, and somewhat at 4000 Hz. In analyzing the directivity data, it is often useful to return to the spectral analysis in order take into account the amount of energy contained in the respective band. The perceived directivity of a sung note is a combination of the directivity pattern as a function of frequency and the energy in each band that contributes to each pattern. For example, the 315 Hz band is of little interest as there is little energy in this band for the given singing condition.
Projection
The term “projection” or “projected voice” is often used in singing for expressing a vocal gesture, or voice quality, aimed at filling large concert space. The singer focuses his attention on the last rows of a concert hall with the idea of projecting the sound of his voice in order to obtain maximal power. Whether a projected voice actually exhibits different radiation patterns is investigated in this study. Our subject produced different sustained vowels with and without voice projection. Results for sung note g1 (French notation laB3) are reported in Figures 7 and 8. The main observed effect of projection appears to be an increase in energy at higher frequencies. Radiation patterns with and without projection are almost identical. For frequencies above 5000 Hz, only the project voice conditions contained sufficient energy above the noise floor for showing measurable radiation patterns. There is a visible increase in energy in the spectrum for the /a/-projected in the region 5000-6300 Hz, and for /o/-projected in the region 6300-10000 Hz. In the spectrum for projected voice, two additional peaks are visible between the first and second harmonic and also between the second and third harmonic. More investigation seems necessary in order to decide if this is a significant feature of projected voice.
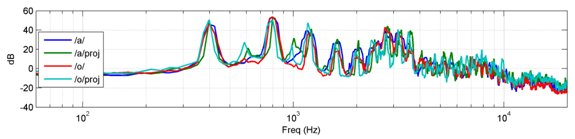
Figure 7. Spectral analysis of sung vowels with and without “projection”.
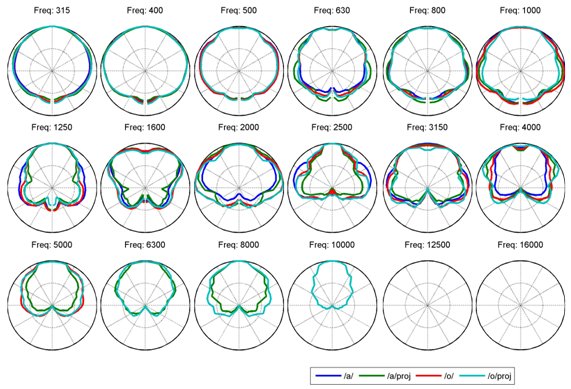
Figure 8. Directivity analysis of sung vowels with and without “projection”.
Running Directivity
In order to better understand the role of directivity during a sung performance, a short musical passage was also recorded using the measurement system. The intent is to try and calculate the “perceived” directivity of the signer. In oerder to summarize the different frequency bands, the data was analyzed using an A-weighting filter, such that the frequencies containing more energy perceived by the human are weighted more. The passage was analyzed using a short time window such that the evolution for the directivity can be perceived during the course of the singing. Finally, a second directivity pattern was considered, in which the pattern was not normalized but maintained the relative level information between frames. The results of such analysis are presented in the following video.
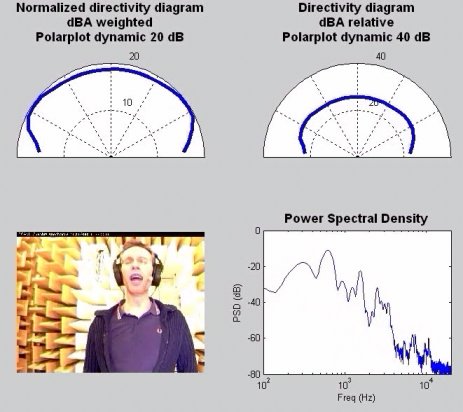
Click the link to the right to view Running voice directivity video (19MB).
Conclusions
Contrary to previous studies, we did not find a significant difference for the different vowels for the sung voice, while the spoken voice showed marked differences for certain frequency bands. The degree of the differences has been analyzed using cluster analysis of the correlation between patterns. Further analysis of phoneme dependant radiation patterns in speech is still under study, and will be compared to the singing data. Acoustic theory predicts that radiation patterns for vocal production depend mainly on the head radius and mouth aperture. This seems to be confirmed by our results. Despite the singer's sensation of projection or focusing, vocal gestures aimed at directing the sound in space, only minimal effect on the radiation patterns are noticeable. A combined spatial-frequency analysis could be used in an effort to interpret the perceived directivity of a sung condition. The consistency of directivity patterns could be a feature related to the specific geometry of the singer's morphology. To the best of our knowledge, no detailed investigation or model on the face geometry or even on the mouth shape (rounded like in /o/ vs. stretched like in /i/) are currently available. More detailed models and measurement of the singer related radiation transfer functions could explain the invariance of radiation patterns across conditions.
References
[ASA2006] Brian F.G. Katz, Fabien Prezat, and Christophe d'Alessandro, “Human voice phoneme directivity pattern measurements.” Fourth Joint Meeting: ASA and ASJ, Honolulu, November 2006, J. Acoust. Soc. Am., Vol. 120(5), Pt. 2, November 2006.
[ICA2007] Katz, Brian F.G. & d’Alessandro, Christophe, “Directivity Measurements of the Singing Voice.” Proceedings of the 19th International Congress on Acoustics, Madrid, 2-7 September 2007.
[1] H. K. Dunn, D. W. Farnsworth: “Exploration of Pressure Field Around the Human Head During Speech,” Journal of the Acoustical Society of America v.10(3) (1939).
[2] J. L. Flanagan: “Analog measurements of sound radiation from the mouth,” JASA v.32(12) (1960).
[3] W.T. Chu, A.C.C. Warnock: Detailed Directivity of Sound Fields Around Human Talkers, NRC-CNRC Report IRC-RR-104 (2002).
[4] T. Halkosaari, M. Vaalgamaa, M. Karjalainen: “Directivity of Artificial and Human Speech,” J. Audio Eng. Soc., Vol. 53, No. 7/8, 2005 July/August.
[5] Malte Kob, Harald Jers: "Directivity measurement of a singer," Journal of the Acoustical Society of America, v.105(2) (1999).
[6] Malte Kob: Physical modeling of the singing voice. Dissertation University of Technology Aachen. Logos-Verlag, Berlin (2002).
[7] F. Bozzoli, A. Farina: “Directivity balloons of real and artificial mouth simulators for measurement of the Speech Transmission Index,” Presented at the 115th convention of the AES, New-York (2003).
LINKS
3D Audiovisual Rendering and Real-Time Interactive Control of Expressivity in a Talking Head