Emotion detection in call center data
Contents |
Object
Affective systems have become a growing field of research in computer science. In this context, the widely used terms of emotion or emotional state are employed without distinction from the more generic term affective state which may be viewed as more adequate from the psychological theory point of view. Most of the previous works on emotion have been conducted on induced or recalled data with archetypal emotions. Some are made in artificial control with acted data [1] but others are realistic (children (11-12 years old) in a situation of game in the AIBO data [2]). Among the experiments involving the classification of several emotions from realistic data, we can quote Batliner who achieved about 60% good classification on the AIBO data discriminating between 4 classes. Our experiments study emotions in natural real-world spoken data collected in a call center. Everyday emotions in real-world context are still rarely studied and most studies focus on a limited number of emotions and on broad classes. Especially with spontaneous data, there are various strategies to express emotions, mixing cues associated to different levels of the acoustic and the linguistic channel. In a previous study comparing lexical model and paralinguistic model [3] on a four-class classification task, we observed that the two channels were complementary, some emotions such as Fear being better recognized with the paralinguistic model and others such as Relief by the linguistic one. On average we obtained 60% of good detection on this four-class classification task. Yet we never looked more precisely at the respective performances using different types of paralinguistic cues (such as F0, Energy, Spectral & formant, microprosody, MFCC) and how adding different type of cues might yield to better emotion recognition. [4] analyzed the result of feature selection (1000 feature originally) with data from actors and from a Wizard of Oz experiment. They reported that good feature sets for acted and WOZ emotions showed to overlap little. In particular they found MFCC related features to be better parameters than prosody for the detection of WOZ emotions (Smart-Com Corpus). With the CEICES project in which we are involved, an evaluation of different feature types [5] was done. In that experiment, MFCC features didn’t appear to be better than prosodic ones. In that paper different set of paralinguistic and linguistic features were compared.
Our general goal is to find robust features characterizing emotional states and useful for affective computing applications. Our aim is to investigate the relative weight of different types of paralinguistic parameters with naturalistic phone data. The difference of the media channel (phone/microphone), the type of data (adult vs. children, realistic vs. naturalistic) and the emotion classes must certainly have an impact on the best relevant set of features. For a simple task, such as Neutral/Fear detection, extracting only one type of features such as F0 related features proved sufficient to yield good performances in our call center corpus [6]. However this is not the case for a complex task such as discriminating between a high number of classes or between close fine grained classes. Then, cues from different levels and channels need to be extracted in order to give the best representation of the big variability of vocal expressions in spontaneous speech. Yet, adding the linguistic channel while aiming at purely automatic detection raises the problem of the feasibility of automatic speech recognition on emotional data. In the same way, adding levels deduced from the manual transcription such as disfluencies [7] or affect bursts [8] require that they be detected automatically. For example, the automatic detection of the affect burst laugh is 85% in [9]. We focuses on the complex task of detecting five emotions on spontaneous data.
Description
The studies reported make use of a corpus of naturally-occurring dialogs recorded in a real-world medical call center. The dialog corpus contains real agent-client recordings obtained from a convention between a medical emergency call center and the LIMSI-CNRS. The use of these data carefully respected ethical conventions and agreements ensuring the anonymity of the callers, the privacy of personal information and the non-diffusion of the corpus and annotations. The aim of this service is to offer medical advice. In this context, the callers often express stress, pain, fear of being sick or even real panic. In many cases, two or three persons speak during a conversation. The caller may be the patient or a third person (a family member, friend, colleague, caregiver, etc.). Many factors such as the personality of the subject, his age, his gender, his role or his relation to the patient will lead to very different manifestations of emotions that will still be assigned the same label.
The transcription guidelines were similar to the LCD transcription approach (www.ldc.upenn.edu). Some additional markers have been added to denote named-entities, breath, silence, intelligible speech, laugh, tears, clearing throat and other noises (mouth noise). The transcribed corpus contains about 20 hours of data. About 10% of speech data is not transcribed since there is heavily overlapping speech. The orthographic transcriptions were aligned with the signal to segment the corpus into phones using existing context-independent models already developed at LIMSI for telephonic conversations. The alignment system uses continuous density Hidden Markov Models (CHMMs) with Gaussian mixtures for acoustic modeling [10]. The vocabulary contains 121k words with a phonetic transcription based on 36 phones.
For annotation, the verbal categories have been obtained from a perceptive test. Twenty classes were selected after a majority voting procedure. Our emotion and meta-data annotation scheme and the choice of our labels have been described in [6]. Meta-data are given at the dialog level. The emotional segments mainly corresponded to the speaker turns but in a few cases the speaker turns were segmented into finer emotional segments where the annotators felt it was appropriate. The scheme specification at the segment level enables annotation of emotion labels and abstract dimensions with one or two emotion labels for segment, selected from fine-grained and coarse-grained labels as well as some local emotional context cues. Only labels are exploited here.
The set of labels is hierarchically organized from coarse-grained to fine-grained labels in order to deal with the lack of occurrences of fine-grained emotions and to allow for different annotator judgments. The coarse classes were decided by 5 people who were familiar with the corpus and a perceptive test will be carried out to verify this hierarchy and the difference between callers’ and agents’ emotions. Fear is the most emotional class in the CEMO corpus with many different levels of intensity and many variations such as Stress or Panic. The Kappa coefficient was computed for agents (0.35) and clients (0.57). Most confusion is between a so-called “neutral state” and an emotional state. Because there can be different perceptions for a same utterance, we considered an annotator as coherent if he chooses the same labels for the same utterance at different times. We have thus adopted a self re-annotation procedure of small sets of dialogs at different time (for instance once a month) in order to judge the intra-annotator coherence over time. About 85% of the utterances are similarly reannotated. A soft emotion vector is used to combine the decisions of the annotators (two or more) and represent emotion mixtures [6]. This representation allows to obtain a much more reliable and rich annotation and to select the part of the corpus without conflictual blended emotions for training models. The presence of blended emotions in our corpus was perceptually verified [11].
The annotation level used to train emotion detection system can be chosen based on the number of segments available. The experiments described were made on a subcorpus containing segments from coarse classes with no emotion mixtures. There are more than 450 speakers in the training set and about 200 different speakers in the test set. Even if in our scheme a same Emotion label can be assigned to a caller and an agent like Fear or Anger, the emotions are clearly not the same. Callers’ Anger and Fear are linked to the urgency of the calls when for the agents, Anger and Fear are much more linked to the stress of their work and to fatigue (a large part of the calls are also during the night). This study focuses on the classification of 5 classes: Anger, Fear, Sadness, Relief and Neutral. Anger includes hot and cold anger and different levels of intensity; Fear is the bigger class with in this experiment Fear, Anxiety Stress and Panic segments. Relief is more confined in the corpus with strong lexical markers which are very specific to this emotion (“thanks”, “I agree”).
The sub-corpus was divided into a test set and a train set with 454 speakers in the train and 193 in the test. Some scarce data from the training set was randomly duplicated in order to have a balanced training set with about 250 utterances per class.
Prosodic features (mainly F0 and Energy) are classical features used in a majority of experiments on emotion detection. For accurate emotion detection in natural real-world speech dialogs, lexical, prosodic, disfluency and contextual cues should be considered and not only the prosodic information. Since there is no common agreement on a top list of features and the feature choice seems to be data-dependent [6] [12], our usual strategy was to use as many features as possible even if many of the features are redundant, and to optimize the choice of features with attribute selection algorithms. In the experiments reported in this paper, we have also divided the features into several types quite similar to those used in the CEICES experiments [5] with a distinction between those that can be extracted automatically without any human intervention (MFCC features, prosodic, spectral features, micro-prosody ) and the others (duration features after automatic phonemic alignment, features extracted from transcription including disfluences and affect bursts).
The Praat program [13] was used for the extraction of prosodic (F0 and energy), microprosody and spectral cues. It is based on a robust algorithm for periodicity detection carried out in the lag auto-correlation domain. Since F0 feature detection is subject to errors, a filter was used to eliminate some of the extreme values that are detected. Energy, spectral cues and formants were only extracted on voice parts (i.e.: parts where Praat detects F0). The paralinguistic features were normalized using Z-norm: zNorm(P) = (P-mean(P))/std(P). The aim is to erase speaker-differences without smoothing variations due to emotional speech.
Our set of features includes very local cues (such as for instance the local maximums or inspiration markers) as well as global cues (computed on a segmental unit). We describe the different types of features used in our experiments in the following paragraphs.
These are the feature used in a standard transcription system [14]. Mel frequency cepstral parameters are extracted from the speech signal every 10 ms using a 30 ms window on a {0- 8kHz} band. For each frame the Mel scale power spectrum is computed and the cubic root taken followed by an inverse Fourier transform. Using a process similar to that of PLP computation [15], 15 LPC-based cepstral coefficients are then extracted. Our aim was to explore the meaningfulness of the traditional features used in speech recognition for emotion detection. The 90 features consist of the maximum and the minimum for the segment of the 15 cepstral coefficients, Delta and Delta2 coefficients. The relative weight of MFCC has been investigated but they haven’t been combined with the other paralinguistic coefficients.
1/ Paralinguistic features extracted without automatic phonetic alignment. - F0 and Spectral features (Z-normalized per speaker): min, median, first and third quartile, max, mean, standard deviation, range at the turn level, slope (mean and max) in the voiced segments, regression coefficient and its mean square error (performed on the voiced parts as well), maximum crossvariation of F0 between two adjoining voiced segments (intersegment) and with each voiced segment(intra-segment), position on the time axis when F0 is maximum (resp. minimum), ratio of the number of voiced and non-voiced segments, formants and their bandwidth, difference between third and second formant, difference between second and first formant: min, max, mean, standard deviation, range. - Microprosody : jitter, shimmer, NHR, HNR - Energy features (normalized): min, max, mean, standard deviation and range at the segment level, slope (mean and max) in the voiced segments, regression coefficient and its mean square error. - Duration features: speaking rate (inverse of the average length of the speech voiced parts), number and length of silences (unvoiced portions between 200-800 ms).
2/ Semi-automatic features using the transcription: Duration features extracted on automatic phonemic alignment
For the moment we only extracted Duration features from the phonetic transcription, mean and maximum phone duration, phonemic speech rate (#phones/ turn length), length (max and mean) of hesitations. Duration features can also be computed on speech detection transcription but with a lot of errors due to speech detection performances on these complex data. Non linguistic event features: inspiration, expiration, mouth noise laughter, crying, number of truncated words and unintelligible voice. These features are marked during the transcription phase.
The set of features described is computed for all emotion segments in order to compare the performances that can be achieved using one type only and study the gain that can be added by mixing them. Therefore, we have focused on the performances that could be obtained using prosodic, spectral, disfluency and non-verbal events cues. The same train and test sets are used as for all experiments. Several studies have shown Support Vector Machine [16] (search of an optimal hyperplan to separate the data) to be an effective classifier for emotion detection. A SVM Gaussian classifier was therefore used for all experiments with the software weka [17]. Because SVM are two-class classification, the multi-class classification is solved using pairwise classification.
Results
Detection results are given using the CL score (class-wise averaged recognition i.e. average of the diagonal of the matrix). It would be difficult to rawly compare our detection rates to those from other studies. For example in [4] 77% of good detection was obtained on acted speech with 7 classes, 28% with 7 classes with WOZ data and 39% with 5 classes on the same data. Indeed, very different scores might be obtained depending on the realism of the data, the classes one is interested in and the certitude with which a label is given. However we can compare different set of parameters, especially by keeping the same test and train sets for all experiments, as we have done in [18].
To ensure that the scores obtained on our test set can be reflective of our data and compare different scores, we need a confidence interval. In order to find one, 80% of all instances of our subcorpus are randomly selected (though as to create the same class distribution as the initial set) to train a SVM model and the 20% left are used as test. This is repeated 250 times so as to obtain a mean and a standard deviation of the CL. The interval [mean-standard deviation, mean + standard deviation] is used as a confidence interval.
To select the best attributes in the set containing all cues, an SVM classifier was used to evaluate the worth of an attribute and the results with the 15, 25, 40, 50, 70 and 80 best features were compared. The best performances were obtained with 25 features. The set might still contain redundant cues and this will be optimized. Features from all the classes were selected. Among the most worthy were the affect bursts (tears, unintelligible voice), the disfluencies (number of hesitations, and their length obtained with the phonemic alignment), duration measures (length of the utterance, speaking rates (#words/signal length; #phones/signal length, 1/average length of voiced parts), F0 and Energy cues (mostly slope on voiced parts and range) and microprosody (jitter, shimmer, HNR). There are few formants parameters in this selection.
Figure 1 gives the different performances using only blind cues. The results obtained on our test set are represented with a cross and the segments represent the “confidence interval” for these results as defined in the beginning of Section 4. All rates are much greater than chance (20% with 5 classes equally distributed) and the performances are comparable for F0, Energy and Formants. Combining them significantly improves the performances. In contrary to WOZ results related in [4], MFCC results, though above chance are not as good as prosodic or formant features in our naturalistic phone data. They don’t seem to improve detection and were not added to the global set. Additional experiments should be done to verify this conclusion.
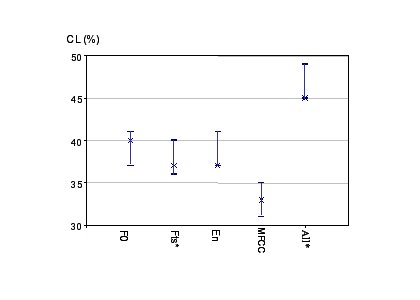
Figure 1: CL detection with F0:only F0 related features, Fts: Formants and bandwidth related features, En: energy related features, MFCC, All (107 features)* : all blind features except MFCC
Figure 2 shows the impact of the additional cues deduced from the transcription and the phonemic alignment. Quite high performances can be achieved with blind features only. With only eleven features each, phonemic durations obtained on phonemic aligment (trans1) and features extracted from the transcription (trans2) enable also to achieve around 45% of good detection. Moreover, mixing blind and semi-automatic features significantly increases the CL score. There is not significant difference between the 25 best features and all 129 features. But this selection shows the meaningfulness of the different types of paralinguistic parameters. Figure 2: CL score for the 5 classes Fear, Anger, Sadness, Relief and Neutral with different set of cues; Blind:all parameters extracted automatically except mfccs (F0, Formants, Energy, microprosody); trans: parameters extracted from the manual transcription, ali: durations from phonemic alignment, all: everything but mfcc, 25-best : 25 best attributes
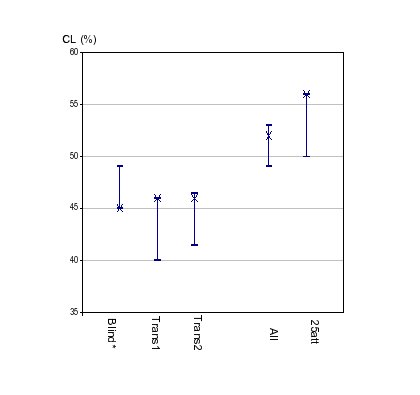
Figure 2: CL score for the 5 classes Fear, Anger, Sadness, Relief and Neutral with different set of cues; Blind:all parameters extracted automatically except mfccs (F0, Formants, Energy, microprosody); trans: parameters extracted from the manual transcription, ali: durations from phonemic alignment, all: everything but mfcc, 25-best : 25 best attributes
As shown in Figure 3, features extracted from the transcription seem to be powerful for the classes Anger, Relief and Neutral. Most of the confusions occur between Sadness/Neutral, Relief /Neutral and Fear/Anger. All scores are above chance. Some emotions are better recognised than others. Out of our 5 classes, Sadness is the least recognized without mixing the cues.
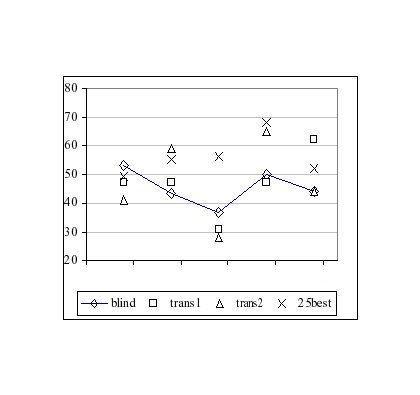
Figure 3: CL score per emotion (Fear, Anger, Sadness, Relief, Neutral) for blind features vs. phone features (trans1) vs. transcription features (trans2) vs. 25 best features.
The good recognition of Relief with features extracted from the phonemic alignment might be explained by the fact maximum length of phones is smaller than for all other classes and there are few hesitations. For Neutral, the speaking rate is slow compared to other emotions and there are very few hesitations and affect bursts, which could explain the better performances with the set of cues deduced from the transcription. This experiment will be reproduced with a larger test set to see if the trends are confirmed.
In previous experiment, we have seen that complex natural emotions are encoded in both the acoustic and the linguistic channel [6]. In the purpose of automatic emotion detection, we are trying to add information associated to the linguistic channel that doesn’t require exact speech recognition. Some cues such as affect burst or disfluences could be detected automatically without any speech recognition. However this is not the case yet for duration cues calculated from phonemic alignment. Still, the more emotional classes there are, the more different cues will be needed to achieve good detection rates. With our corpus, MFCC coefficients don’t appear to be as good as other features. As for other cues, mixing them improves significantly the detection rates. Moreover, some cues are better for different specific emotions. In the future, this needs to be further explored as well as the impact of the channel(phone/micro and of the type of the data(acted/realistic/naturalistic).
References
[1] Dellaert, F., Polzin,, T., Waibel, A., “Recognizing emotion, in speech”, Proceedings of 4th International Conference on Spoken Language Processing, 3,1996, p 1970-1973.
[2] Steidl, S., Levit M., Batliner, A., Nöth, E. & Niemann, E., “Off all things the measure is man Automatic classification of emotions and inter-labeler consistency”, Proceeding of the IEEE ICASSP,2005.
[3] Devillers, L., Vidrascu, L., "Real-life emotions detection with lexical and paralinguistic cues on Human-Human call center dialogs", Interspeech 2006.
[4] Vogt, T., André, E., “Comparing Feature Sets for Acted and Spontaneous Speech in View of Automatic Emotion Recognition”, ICME, 2005.
[5] Batliner, A. et al, “Whodunit — Towards the most Important Features Signalling Emotions in Speech: a Case Study on Feature and Extraction Types”, submitted in ACII 2007.
[6] Devillers, L., Vidrascu, L., Lamel, L., Challenges in reallife emotion annotation and machine learning based detection, Journal of Neural Networks 2005, 18/4, “Emotion and Brain”
[7] Devillers, L., Vasilescu, I., Vidrascu, L., « Anger versus Fear detection in recorded conversations”, Proceedings of Speech Prosody, 2004, p 205-208.
[8] Schröder, M., “Experimental study of affect bursts”, Proc. ISCA workshop “Speech and Emotion”, Newcastle, Northern Ireland , 2000, p 132-137.
[9] Devillers, L., Vidrascu, L., “Positive and Negative emotional states behind the laugh in spontaneous spoken dialogs” submitted to the workshop The phonetics of Laughter, Saarland, 2007
[10] Adda-Decker, M., Lamel, L., “Pronunciation variants across system configuration, language and speaking style”, Speech Communication. 29, 1999, p 83-98.
[11] Vidrascu, L., Devillers, L.,”Real-life emotions in naturalistic data recorded in a medical call center” LREC, Genoa, 2006.
[12] Juslin, P.N., & Laukka, P., "Communication of emotions in vocal expression and music performance: different channels, same code?." Psychological Bulletin: 129 (5), 2003, p 770–814.
[13] Boersma, P, “Accurate short-term analysis of the fundamental frequency and the harmonics-to-noise ratio of a sampled sound”, Proceedings of the Institute of Phonetic Sciences, 1993, p 97-110.
[14] Gauvain, J.L., “The LIMSI broadcast news transcription system, Speech Communication}, vol.37, no. 1-2, 2002, pp. 89-108.
[15] Hermansky, H.,”Perceptual linear predictive (PLP) analysis of speech, J.Acoustic. Soc. America, vol.87(4) , 1990, p. 1738--1752.
[16] Vapnik, V.N., The Nature of Statistical Learning Theory, Springer-Verlag, 1995.
[17] Witten, I.H., Franck, E., Trigg, L., Hall, M., Holmes, G. & Cunningham, S.J., “Weka: Practical machine learning tools and techniques with Java implementations”, Proc ANNES’99 International Workshop: Emerging Engineering and Connectionnist-Based Information Systems, 1999, p 192-196.
[18] Batliner, A. et al.: Combining Efforts for Improving Automatic Classification of Emotional User States. In: Proceedings of IS-LTC 2006, Ljubliana (2006) 240–245