TSF: butane isobutane silicalite
Contents |
Adsorption kinetics of butane and isobutane in silicalite measured by thermal frequency response
Objectives
Diffusion and adsorption of alkanes in silicalite is of major importance both for fundamental understanding of the elementary processes involved in adsorption and for separation and synthesis processes in petrochemistry. During the last few years the TSF adsorption team has measured many alkanes adsorption kinetics on both industrial silicalite pellets [1] and on laboratory synthesized large crystals [2]. The present study concerns a comparison of the diffusion of butane and isobutane taken as the prototypes of linear and ramified alkanes. It has been initiated through collaboration with the International Research Group on the Diffusion in Zeolite1. LIMSI's TSF group applies Thermal Frequency Response (TFR) [3, 4], an original technique, for studying adsorption kinetics.
Description
TFR measurements of adsorption kinetics in silicalite have been made for both n-butane and isobutane. The silicalite-1 sample of high crystallinity, high Si/Al ratio, consists of large crystallites (16.7 µm effective radius). It has been supplied by W. Schmidt (Max-Planck Institut of Mülheim). Three samples of masses 100, 180 and 300 mg have been studied. The experiments and the method used to extract the values of the diffusivity from the TFR spectrum have been presented in our precedent scientific report [2]. The heat and mass transfer parameters are extracted from the TFR spectra by curve-fitting with a two scales non-isothermal diffusion model. This model takes into account thermal diffusion, intercristalline and intracristalline mass diffusion resistances [3]. All the diffusivities given here have been corrected by the well known thermodynamics factor. More details can be found at the following adress: http://www.limsi.fr/Individu/bourdin/silicalite.html.
Results
Isobutane diffusivity in silicalite
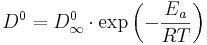
TFR spectrums have been measured with temperatures ranging from 282 to 392 K. The loadings range from 0.27 to 4.5 molecules per unit cell (mpuc). The diffusivity depends on the temperature and on the adsorbate concentration. To separate the two influences, we decided to proceed to a least error analysis to fit the following phenomenological model of dependence. The dependence on T follows Arrhenius law i.e.:
 (1)
(1)
To characterize the dependence on the adsorbed mass q we have chosen the following phenomenological equation:
 (2)
(2)
 is the limit of the diffusivity at zero adsorbed concentration when the temperature tends towards infinity.
  is the activation energy, A, n are dimensionless parameters. All the parameters are adjusted to minimise the relative error between calculated and TFR measured values of the diffusivity. The following values are found to minimize the error:
|
|
 |
 |
Mean relative error |
|---|---|---|---|---|
| 5.85.10-8 m2/s | 25.45 kJ/mol | 1.00466 | 4.126 | 10.7% |
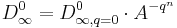
The result is shown opposite in figure 1: red diamonds for the TFR measurements, the green line “Calc. 1” is the best fit obtained when only the temperature influence is taken into account (Equation 1,  being taken as constant), green triangles “Calc. 2” are the calculated values when both temperature (Equation 1) and loading (Equation 2) are taken into account. The brown lines represent calculated isosters at 0 and 5 mpuc.
The slope of the green line “Calc. 1” shows clearly that if the entire trend is erroneously attributed to the temperature influence, an overestimated value of the activation energy is calculated.
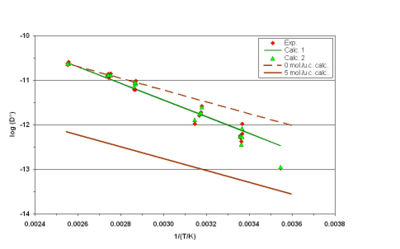
The TFR results are compared with values reported in literature and given by other experimental techniques –membrane [5], QENS [5], CPC [6, 7], SCM [8], ZLC [9-11]– and molecular simulations [12-16]. The figure 2 below presents the most significant results. In this Arrhenius plot, the literature diffusivities are plotted versus the diffusivity values calculated by our TFR based phenomenological model in the same conditions. The separation of a point from the diagonal is a measure of the discrepancy between this point and our TFR measurement based model.
being taken as constant), green triangles “Calc. 2” are the calculated values when both temperature (Equation 1) and loading (Equation 2) are taken into account. The brown lines represent calculated isosters at 0 and 5 mpuc.
The slope of the green line “Calc. 1” shows clearly that if the entire trend is erroneously attributed to the temperature influence, an overestimated value of the activation energy is calculated.
The TFR results are compared with values reported in literature and given by other experimental techniques –membrane [5], QENS [5], CPC [6, 7], SCM [8], ZLC [9-11]– and molecular simulations [12-16]. The figure 2 below presents the most significant results. In this Arrhenius plot, the literature diffusivities are plotted versus the diffusivity values calculated by our TFR based phenomenological model in the same conditions. The separation of a point from the diagonal is a measure of the discrepancy between this point and our TFR measurement based model.
Figure2 shows that TFR measurements are fairly described by the phenomenological model (equations 1 and 2) proposed. It appears that this model follows the general tendency of the literature diffusivities even for diffusivities far above the highest TFR measure. We can conclude that, with some notable exceptions, the published values of isobutane diffusivity are in agreement with our TFR measurements.
Butane diffusivity in silicalite
Measurements have been done with temperatures ranging from 263 to 365 K and loadings ranging from 1.1 to 8.0 mpuc. The same phenomenological equations (1, 2) have been used to characterize the trend of the diffusivity. The following values of the parameters are found to minimize the error:
|
|
|
|
Mean relative error |
|---|---|---|---|---|
| 7.06.10-6m2/s | 21.45 kJ/mol | 1.0000364 | 5.894 | 85% |
The poor mean relative error is due to several diffusivities deduced from a very poor adjustment between experiment and model. If the corresponding measurements are excluded then the mean relative error is reduced to 36%. Anyway it is clear that the measurements on butane are less accurate than those on isobutane. For n-butane-silicalite diffusion the intracristalline resistance affects only the high frequency domain of the TFR spectra where the S/N ratio is the worse. This makes the adjustment experiment-model uncertain for several experiments with n-butane.
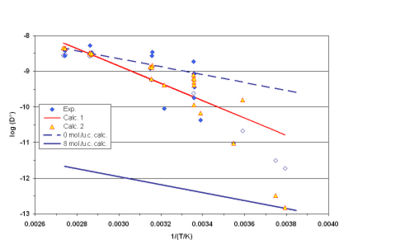
The result is shown opposite in figure 3: blue diamonds for the TFR measurements, open symbols correspond to experiments for which it has not been possible to find good adjustment between model and experiment. For these experiments only an order of magnitude has been determined by adjusting the model on the high frequency roll-off of the spectra. The red line “Calc. 1” is the best fit obtained when only the temperature influence is taken into account, red and yellow triangles “Calc. 2” are the calculated values when both temperature and loading are taken into account. The blue lines represent calculated isosters at 0 and 8 mpuc.
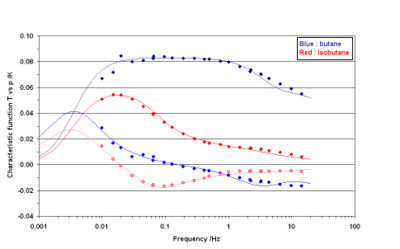
Another difficulty for measuring n-butane lie in the predominance of the intercristalline resistance: in quite all experiments the intercristalline diffusion time is higher than the intracristalline one. The determination of the intracristalline diffusion are then of poor accuracy and the dispersion of the measurement preclude a precise determination of the influences of temperature and of the loading on the diffusivity. Nevertheless it is doubtless that the n-butane diffusivity is higher than the isobutane diffusivity by two to three orders of magnitude. This is clearly proved by the comparison of iso and n-butane TFR spectra (see for instance figure 4).
The TFR results have been compared with values reported in literature and given by other experimental techniques – QENS [17], NMR [18, 19], FR [20, 21], CPC [6, 7], ZLC [9,11] – and molecular simulations [22]. The figure 5 below presents the most significant results. This plot is constructed the same way as figure 2. As for the case of figure 3, open symbols correspond to experiments for which it has not been possible to find good adjustment between model and experiment.
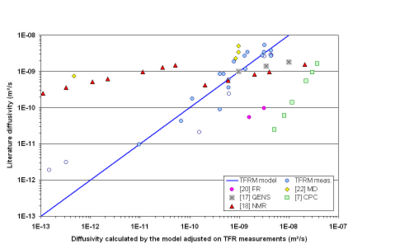
Figure 5 shows that the phenomenological model (equations 1 and 2) gives only a statistical description of the TFR measurements. It appears that TFR diffusivities are higher than other macroscopic measurements (FR [20], CPC [6, 7]). The trend of the macroscopic series reveals a higher sensitivity to the temperature and loading than the microscopic measurements QENS [17] and PFG NMR [18]. Nevertheless, the order of magnitude of TFR values for temperature above 290K is the same as the macroscopic methods one. At low temperature and high loading TFR measurements do not agree with PFG NMR and molecular dynamics. The reason is probably the huge uncertainty of the TFR curve fitting for these conditions. To sum up, the order of magnitude of the TFR determinations of butane diffusivity in silicalite at temperature higher than ambient agrees with the microscopic measurements. The influence of temperature and loading on the diffusivity seems to be overestimated by TFR measurements. This is probably the consequence of a huge uncertainty in the curve fitting for the experiments in low temperature and/or high loading conditions.
Conclusions
Isobutane and n-butane Silicalite-1 adsorption kinetics have been studied by TFR. The diffusivities and activation energy measured by TFR for the isobutane/silicalite system are in good agreement with the results of the literature. Uncertainty of the curve fitting in certain conditions has precluded a precise determination of the diffusivity of n-butane in silicalite. Nevertheless, the TFR diffusivities are of the same order of magnitude as the microscopic method diffusivity. At ambient temperature the n-butane diffusivity is two to three orders of magnitude above the isobutane one. We can conclude that the apparently low intracrystalline n-butane diffusivities given by some macroscopic methods (ZLC, CPC, and FR) are due to the intrusion of some out-of-control external resistance in the experiment and not to some mysterious physical process. If it were not the case the same process would affect TFR measurements too.
We gratefully acknowledge W. Schmidt2 of the Max-Planck Institut of Mülheim for providing us with the silicalite sample and SEM images of the crystals. We are grateful to C. Beau technician at LIMSI for the development of a new amplifier for the pressure gauge.
1. http://www.grenzflaechenphysik.de
2. http://www.mpi-muelheim.mpg.de/kofo/institut/arbeitsbereiche/schmidt/schmidt_e.htm.
References
[1] Dubreuil A.-C., A. Méthivier, D. Bisch and V. Bourdin, Etude de la Cinétique de Diffusion du butane, du pentane et des différents isomères de l’hexane dans la zéolithe MFI ZSM-5/Silicalite, rapport du contrat IFP 28404 (2004).
[2] D. Bisch and V. Bourdin, Measurement of adsorption kinetics of isobutane in silicalite, scientific report (2005)3.
[3] Bourdin V., Ph.Grenier, F. Meunier and L. M. Sun, Thermal Frequency Response Method for the Study of Mass-Transfer Kinetics in Adsorbents, AIChE J., 42, n°3, 700-712 (1996).
[4] Bourdin V., P.G. Gray, Ph.Grenier and M.- F. Terrier, An apparatus for adsorption dynamics studies using infrared measurement of the adsorbent temperature, Rew. Sci. Inst., 69, N°5, 2130-2136 (1998).
[5] Millot B., A. Méthivier, H. Jobic, H. Moueddeb, and M. Bée, Diffusion of Isobutane in ZSM-5 Zeolite: A Comparison of Quasi-Elastic Neutron Scattering and Supported Membrane Results, J. Phys. Chem. B, 103, 1096-1101, (1999).
[6] Chiang A. S., A. G. Dixon and Y. H. Ma, The determination of zeolite crystal diffusivity by gas chromatography – II. Experimental, Chem. Eng. Sci., 39, n°10, 1461-1468, (1984).
[7] Hufton J. R., and R. P. Danner, Chromatographic Study of Alkanes in Silicalite: Transport Properties, AIChE J., 39, n°6, 962-974 (1993).
[8] Paravar A. and D.T. Hayhurst, Direct Measurement of Diffusivity for Butane Across a Single Large Silicalite Crystal , Proc. 6th. Int. Zeolite. Conf., Olson D. and A. Bisio Eds., Butterworths, 217-224, (1983).
[9] Jiang M., M. Eic, S. Miachon, J.-A. Dalmon, M. Kocirik, Diffusion of n-butane, isobutane and ethane in a MFI-zeolite membrane investigated by gas permeation and ZLC measurements, Sep. Pur. Tech. , 25, 287-295, (2001).
[10] Zhu W., A. Malekian, M. Eic, F. Kapteijn, J.A. Moulijn, Concentration-dependent diffusion of isobutane in silicalite-1 studied with the ZLC technique, Chem. Eng. Sci., 59, 3827-3835, (2004).
[11] Hufton J. R., and D. M. Ruthven, Diffusion of Light Alkanes in Silicalite Studied by the Zero Length Column Method, Ind. Eng. Chem. Res., 32, 2379-2386 (1993).
[12] Chandross M., E. B. Webb III, G. S. Grest, M. G. Martin, A. P. Thompson, and M. W. Roth, Dynamics of Exchange at Gas-Zeolite Interfaces I: Pure Component n-Butane and Isobutane, J. Phys. Chem. B, 105, 5700-5712, (2001).
[13] Fried J. R. and S. Weaver, Atomistic simulation of hydrocarbon diffusion in silicalite, Comp. Mat. Sci., 11, 277-293, (1998).
[14] Furtado E. A., I. Milas, J. O. Milam de Albuquerque Lins and M. A. Chaer Nascimento, The dehydrogenation reaction of light alkanes catalyzed by zeolites, phys. stat. sol. (a), 187, n° 1, 275-288, (2001).
[15] Paschek D. and R. Krishna, Monte Carlo simulations of sorption and diffusion of isobutane in silicalite, Chem. Phys. Let., 342, 148-154, (2001).
[16] Krishna R. and D. Paschek, Verification of the Maxwell-Stefan theory for tracer diffusion in zeolites, Chem. Eng. J., 85, 7-15, (2002).
[17] Jobic H., M. Bée, and J. Caro, Translational mobility of n-butane and n-hexane in ZSM-5 measured by Quasi-Elastic Neutron Scattering, 9th Int. Zeol. Conf., Montreal 1992 Eds. R von Ballmoos et al. Butterworth-Heinemann, 121-128, (1993).
[18] Heink W., J. Kärger, and H. Pfeifer, K. P. Datema and A. K. Nowak, High-temperature pulsed field gradient nuclear magnetic resonance self-diffusion measurement of n-alkanes in MFI-type zeolites, J. Chem. Soc. Faraday Trans., 88, 3505-3509 (1992).
[19] Shen D., L.V.C. Rees, J. Caro, M. Bülow, B. Zibrowius and H. Jobic, Diffusion of C4 hydrocarbons in silicalite-1, J. Chem. Soc. Faraday Trans., 86, 3943-3948 (1990).
[20] Van-den-Begin N. G. and L.V.C. Rees, Diffusion of hydrocarbons in silicalite using a frequency-response method, Zeolites: facts, figures, future. Eds. P. A. Jacobs and R A. van Santen. Elsevier Science Publishers, 915-924, (1989).
[21] Shen D. and L.V.C. Rees, Adsorption and diffusion of n-butane and 2-butyne in silicalite-1, Zeolites, 11, 684-689 (1991).
[22] Leroy F., B. Rousseau and A. H. Fuchs, Self-diffusion of n-alkanes in silicalite using molecular dynamics simulation: a comparison between rigid and flexible frameworks, Phys. Chem. Chem. Phys., 6, 775-783, (2004).
Links
Home > Group Solid-Fluid Transfers >> This page
1. http://www.grenzflaechenphysik.de
2. http://www.mpi-muelheim.mpg.de/kofo/institut/arbeitsbereiche/schmidt/schmidt_e.htm.
3. http://www.limsi.fr/Rapports/RS2005/meca/tsf/tsf5/index.html